Explore
The dataset comprises many diverse data types, ranging from brain imaging modalities to eye tracking to measurements of heart beat and respiration. This page offers a few demos to provide a glimpse into a selection of the data types and also a few quality metrics used to investigate the utility of the dataset. A comprehensive assessment can be found in the associated data papers that are available for every dataset component listed on the Data Page.
An interactive walk-through tutorial is also available on Binder to provide
hands-on experience with the StudyForrest dataset and DataLad:
![]()
The "Hairy" Brain
Diffusion-weighted imaging (DWI) is a technique that can be used to visualize neural tracts or nerve fibre bundles by measuring the direction of water diffusion in brain tissue. The example figure below shows a so-called connectome — the structure of nerve fibre pathways in the brain — estimated from the DWI data of a single individual. The red horizontal lines in the center of the image show the corpus callosum, the bridge between the two brain halves. The blue vertical lines in the lower center of the image show the corticospinal tract, where the brain is connected with the nervous system in other parts of the body. The provided scans have been made with a standard clinical procedure at 2 mm spatial resolution.
Left-click and drag to rotate the view, middle-click to pan, and scroll (or right-click) to zoom in and out.
The Colorful World of Brain Function
One way to analyze brain function is to contrast where the brain consumes oxygen differently between particular conditions. A number of such analysis results have been published on the NeuroVault platform to enable further meta-analysis. Browse through the topics and see how individual brain areas respond differently.
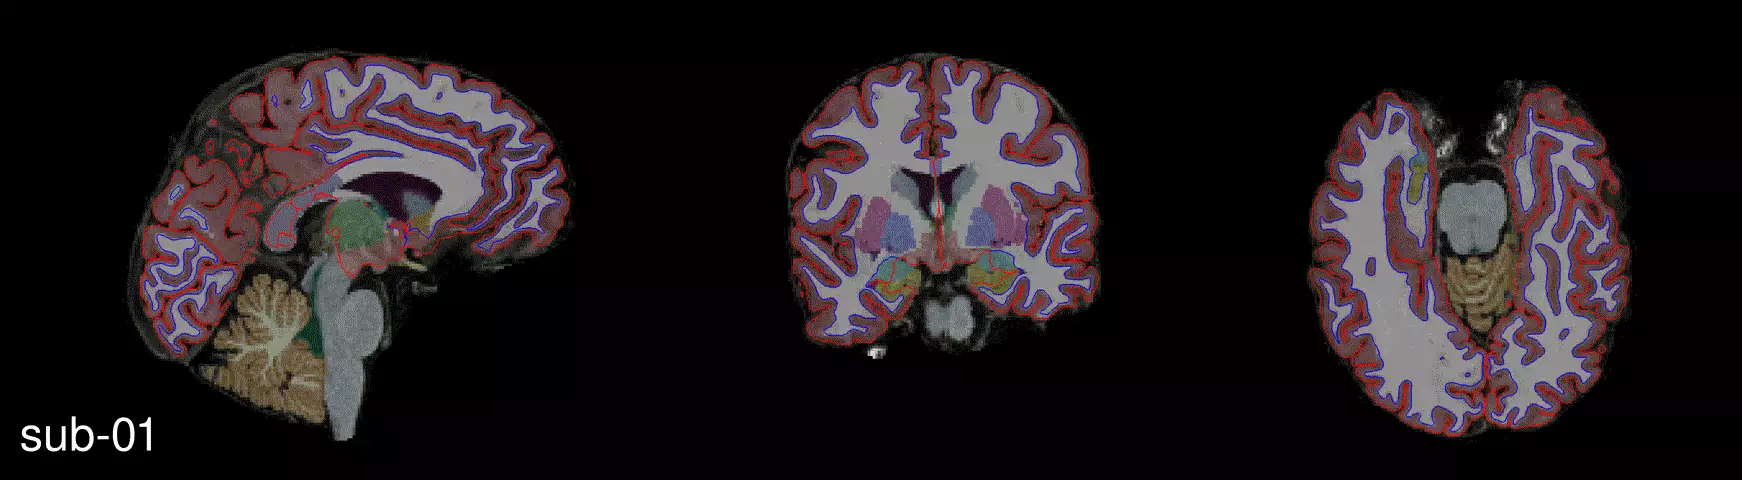
Brain Parcellations
High-resolution structural brain images, such as those acquired with T1- and T2-weighted MRI, can be used to reconstruct and label regions on the cortical surface as well as subcortical brain structures. Such parcellations of the brain into distinct but interacting regions support research into the fundamentals of brain organization and function. Using the FreeSurfer software package, structural data from 20 subjects were reconstructed into brain parcellations. The animation below shows this in three views for each subject, allowing for a quick quality inspection.
Functional Data Quality
Since head movement during the acquisition of a functional MRI time series can be detrimental for the eventual data analysis and results, volume-to-volume head movement parameters are typically inspected as a quality indicator of fMRI data. Framewise displacement (FD) captures head movement in a single value per volume, resulting in an FD time series per functional run. Below we present interactive distribution plots of FD values for all participants over all runs of the 7T dataset. Distributions and an example time series are also presented for a single subject and a single run.